
It’s my 40th birthday this month, so to celebrate, I decided to do my first biological age calculation using the Bortz clock, which uses a lot more biomarkers than the PhenoAge clock I’ve been using.
It also includes all of the biomarkers that PhenoAge uses, so you get both clocks from the same test.
Results
The results came in at 23.4 years old which is 16.5 years younger than my chronological age!
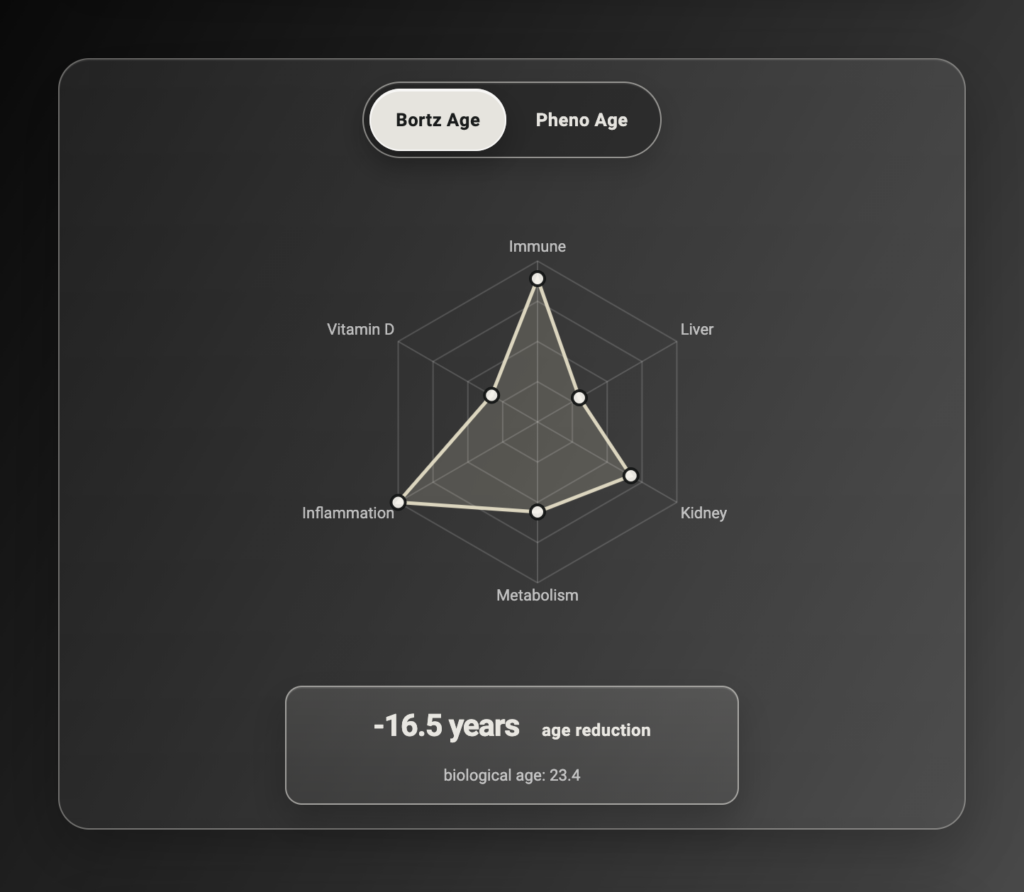
This is a big improvement on the PhenoAge test from a year ago which had me at 26.7 years old.
It means that in the last year, my biological age (which really means my pace of mortality risk equivalency) improved by 3.4 years!
Other stats for comparison:
- Lifetime average pace of aging from 0.69 to 0.58 years per year 🐢
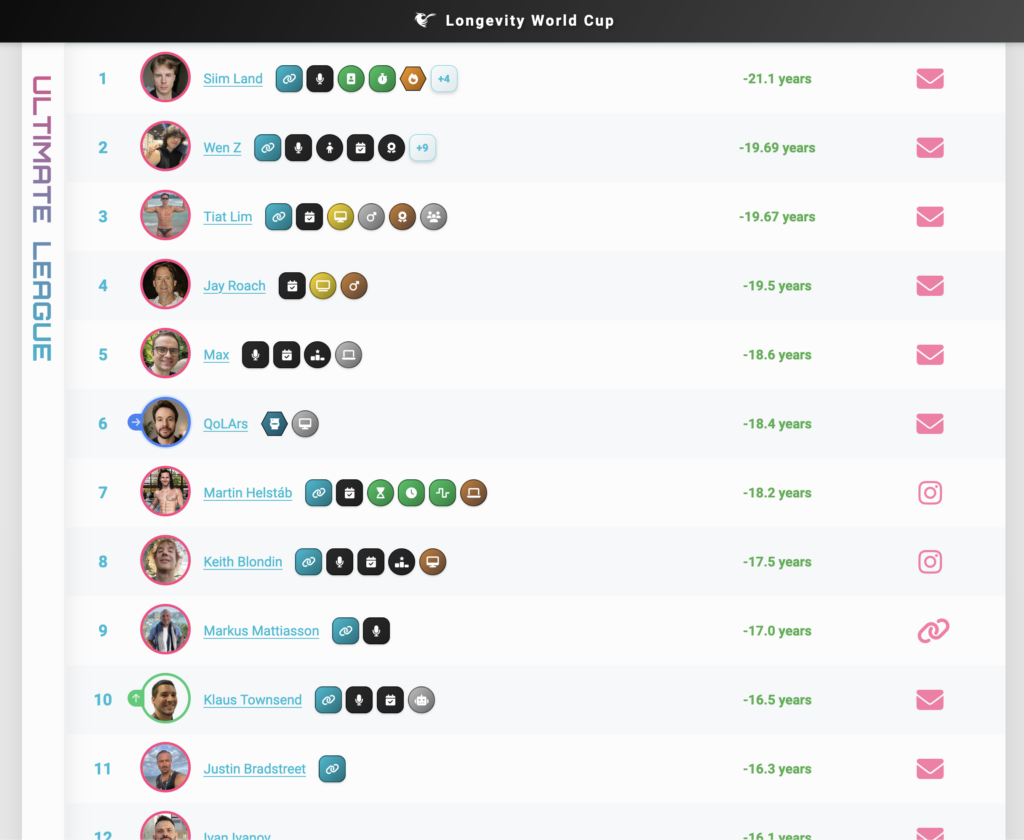
- Went from 100th to 10th place overall 🎉
- Gained 6th place overall in Bortz pace of aging 🎉
- Went from 3rd to 1st place in the Millennials Open League 🥇
- Went from 3rd to 1st place in New Zealand 🇳🇿 🥇
- Went from 13th to 2nd place in the Open League 🥈
Biological Age Clocks
Those of you who follow me know that I always make sure to point out the caveats and misconceptions about biological age clocks, so I won’t get into those points yet again.
I did an article and video about it earlier in the year, and talked about it in more detail on the Immortal Combat podcast.
I’m working on my own clock which takes care of most of the problems I see with PhenoAge and Bortz, and it is getting very close to its first public release, but that’s for a future post.
For now, let’s talk about how I managed to improve on my previous results of these current clocks.
Results Comparison
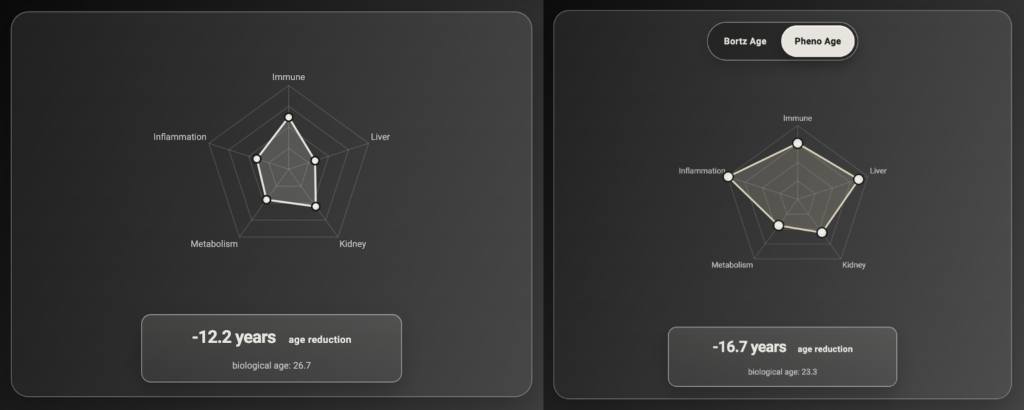
This comparison shows a breakdown of the PhenoAge results into 5 sections. You can see there were major improvements in my liver and inflammation markers, small improvements in immunity markers, while metabolism and kidney markers stayed about the same.
The great thing about blood-based clocks like this is that they are transparent and actionable, not just a magic number. So looking further into those stats, we can see:
Inflammation
CRP, a marker of systemic inflammation, improved a lot. I am pretty proud of this, because the lab was unable to detect any CRP at all, which means my “inflammaging” is as close to perfect as anyone.
Immunity
This grouping uses white blood cells, lymphocytes, MCV, and RDW. PhenoAge likes high lymphocytes, low white blood cells, low MCV, and low RDW.
In this test, my lymphocytes went up from 32.7% to 37%, and my white blood cell count went down from 5.2 to 4.6 billion cells/L. The other 2 markers got a little worse, but that didn’t make much difference due to the big gains in lymphocytes and WBC.
Liver
The liver markers that PhenoAge looks at are albumin and alkaline phosphatase (ALP). It likes high albumin and low ALP.
ALP has been a major focus for me in the last year, because while mine is still within what many consider the “optimal range”, it’s on the high side of it so I would rather be on the low side of it. In this test, both of those numbers moved in the right direction.
Metabolism & Kidney
PhenoAge looks at one marker for each of these – glucose and creatinine. Unfortunately these are two of the weakest parts of PhenoAge itself.
Firstly, glucose fluctuates so much throughout the day. I have worn a CGM (Continuous Glucose Monitor) so I know I am very happy with my insulin sensitivity.
I also took 8 blood tests in the last 12 months, and this was my second-worst result. My best was 4.6mmol/L, and worst was 5.2mmol/L. This test was in the middle at 4.9mmol/L.
These are all good values, but unfortunately the way that PhenoAge works – it’s a linear equation, and it doesn’t know about HbA1c – it is heavy-handed with blood glucose.
Creatinine is similarly misleading because it’s used traditionally to detect kidney damage, which works to a degree in certain people, but for healthy people it ends up being a proxy for muscle mass.
That’s because creatinine is a waste product of muscle. That’s true for everyone, but when you have more muscle, you’re releasing more creatinine into your blood stream just from its general maintenance, and in a blood test, that looks the same as someone with low muscle whose kidneys are too slow to filter the creatinine from the blood. Same number, but totally different cause.
In the case of both glucose and creatinine, Bortz uses the better marker. It still looks at them both, but it also introduces HbA1c and cystatin C. As a result, it ends up actually rewarding creatinine, because it can trust cystatin C as a marker of kidney health and then focus on creatinine being a marker of muscle metabolism and fitness.
How I Did It
I track all of my significant lifestyle changes on this blog, so the information is already out there. I’m not trying to hold on to any secrets, I make it all open and public so it can benefit the greatest number of people. Many people say they do that, but few really do it.
A summary of the changes I’ve made in the last year that correlated with better blood tests and lower biological age are:
- Reduced physical stress by resting more throughout the day. My wearable identified that while my nighttime recovery and overall resilience were allowing me to keep my stress balanced, the fact that I wasn’t resting at any point in the day was less than optimal. Now, instead of standing and walking on my treadmill all day, I have started sitting down for about an hour in the daytime for a break, and that has made a significant difference to my physiological stress.
- Increased daily protein intake from around 0.6g/KG/day to 0.8 – which in absolute numbers is around 50g per day to 70g – by adding tinned sardines. That’s still pretty low for a lot of people, but for whatever reason, my body seems optimized for low amounts of protein. This is supported by DNA analysis, as detailed on the Biomarkers page. My biomarkers have all got worse when I have experimented with high amounts like 1.4 or 1.6g/KG/day, and I have good strength and muscle response to exercise. I credit this slight protein increase to my lymphocyte percentage getting higher.
- Improved blood vessel health by increasing intake of leafy greens, beets, and citrulline.
- Focused on vo2max by adding weekly runs and walking more, on top of my existing high intensity training and active lifestyle.
- Increased intake of whole, plant foods, particularly root vegetables (sweet potato, carrots, beets) and berries.
- Lots of supplement changes, probably the biggest ones were adding ergothionine and spermidine, reintroducing mushroom extracts, and increasing glycine.
If you want to see all the details, including ups and downs, you can go to my Protocol and Biomarkers pages and see everything including changelogs. If you want to see future updates, consider subscribing to my newsletter on the left.