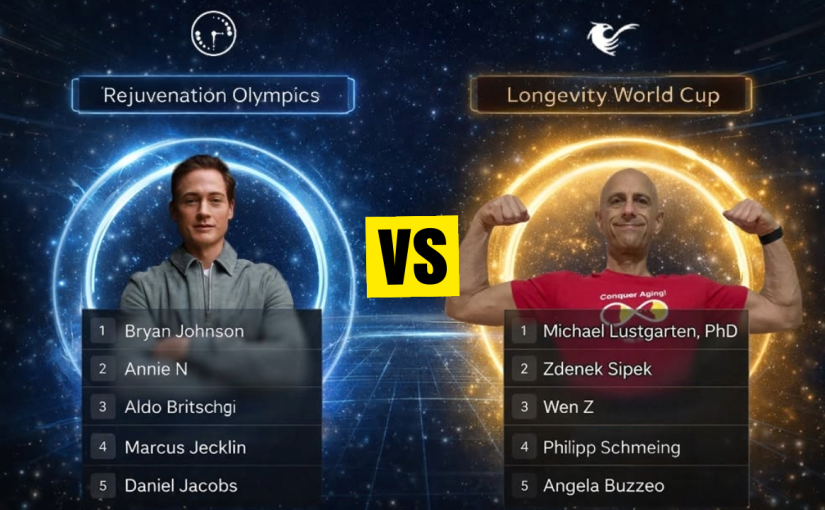
The inaugural season of the Longevity World Cup (LWC) has officially concluded, and huge congratulations to Mike Lustgarten for taking first place overall!
Click here for the video version on YouTube.
Mike has been working hard at optimizing his biology for a long time, and most impressively, he has prevented an increase in his phenotypic age (and I’ll explain what that really means soon) for 7 years in a row:
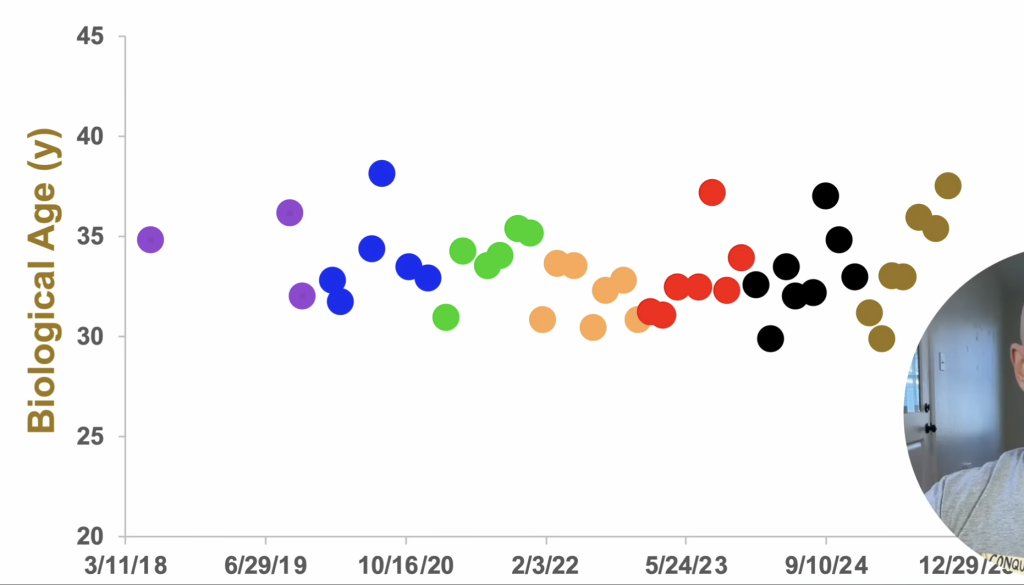
This is absolutely amazing and he deserves the win!
Another huge congratulations to Bryan Johnson who is on top of the Rejuvenation Olympics as we enter 2026. He puts a lot of time and effort into optimizing his biology as well, and has probably done more than anyone to popularize longevity.
As we look towards the 2026 competitive season, let’s answer some questions:
- What are biological age clocks really?
- How accurate is the biological age measurement used in the LWC?
- How does LWC compare to the Rejuvenation Olympics?
- What were my results from this season?
- What can we look forward to in the 2026 season?
Biological Age Clocks
Biological age clocks are not all created equal. In fact, I consider most of them untrustworthy, usually because they are offered by companies who develop them as products to make money from, and that usually prevents them from being vetted by the scientific community.
This season, the Longevity World Cup used Phenotypic Age for its biological age calculation. It is often referred to as PhenoAge, but almost always when people say PhenoAge they mean Phenotypic Age. Phenotypic age is the more accurate version of PhenoAge (AKA DNAm PhenoAge), which is the epigenetic clock developed by the same team.
The authors state:
[…] the phenotypic age measure used to select CpGs is a better predictor of morbidity and mortality outcomes than DNAm PhenoAge
Phenotypic Age is probably the most widely-used and respected biological age clock, and is the benchmark that newer clocks test themselves against, for a few reasons:
- It was developed by well-known scientists across relevant fields like Steve Horvath1, Luigi Ferrucci2, Morgan Levine3, Brian H Chen4, and more.
- It was peer-reviewed by- and published in the respected journal Aging5.
- It was trained on the NHANES III database which is a representative sample of the U.S. population, using complete data on 42 biomarkers from 9,926 adults over 23 years, and was further validated against the NHANES IV database.
- Despite the high level of accuracy – 96% with its own dataset6 – and complexity, it is simple to calculate and can be done using regular blood test results from any lab in the world.
- Its source is completely open for everyone, which brings all the usual benefits of open source, including a constant peer-review process and assurance that the results were not financially motivated.
Contrary to popular belief, most biological age clocks do not attempt to tell you your biological age at all. They are trained on mortality data, meaning that if you get a biological age of 40, what that really means is that your biomarkers (usually from blood, sometimes saliva) are correlated with a similar mortality risk of the average person who is 40.
In fact, Jan Gruber – author of biological age clocks like LinAge2 and DoliClock, as well as over 800 publications on PubMed7 – advocates for reframing biological age as risk-equivalent age in an article published in Nature Aging8.
I sometimes think it would be even better to take it a step further and decouple the concept from “age” completely, and instead label them as mortality risk indices, where you would convey the same information with a number from 0-100 instead of an “age”. That would feel more honest and transparent to me, but it’s also fun to have things like a “pace of aging” so I get why people like pretending that “biological age” is a thing.
Phenotypic Age is highly correlated with mortality and functional outcomes. The correlation is so strong that increasing Phenotypic Age by only one year is associated with the following:
- 9% increase in all-cause mortality risk
- 10% increase in the risk of CVD mortality
- 9% increase in the risk of aging-related disease mortality
- 7% increase in the risk of cancer mortality
- 20% increase in the risk of diabetes mortality
- 9% increase in the risk of chronic lower respiratory disease mortality
In terms of accuracy, interestingly we do not want a biological aging clock to have an accuracy with age of 100%. As the authors of SevenAge state9:
[…] it is essential to emphasize that a perfect [score] would be meaningless in the context of biological aging, as it would indicate a model that solely predicts chronological age without capturing any biological variation.
[…] if a model predicted only the mean age value for all samples, i.e., a flat line without variance, and were corrected with our method, it would yield an artificially perfect chronological age model and consequently lack the critical biological information necessary for meaningful interpretation.
LWC vs. Rejuvenation Olympics
As far as I’m aware, these are the only two active longevity leaderboards. Despite the similar concept, there are major differences between the two leaderboards, so let’s compare them:
| Longevity World Cup | Rejuvenation Olympics | |
|---|---|---|
| Creator | Adam Fiscor | Oliver Zolman and Bryan Johnson |
| Aging clock | Phenotypic age | DunedinPACE (Dunedin Pace of Aging Calculated in the Epigenome). |
| Training data | 9,926 people across the USA (NHANES III) | 954 people from one city; Dunedin, New Zealand (The Dunedin Study) |
| Type of test | Regular bloodwork | DNA methylation |
| Source | Any lab | TruDiagnostic or affiliated partner |
| Accuracy | 96-97% | 93-98%10 |
| Verifiable | Yes, open source and easy to use | Semi – DunedinPACE is open source11, but the leaderboard isn’t, not many labs can do the test, and difficulty is high |
| Prize | Bitcoins | Bragging rights |
| Cost | Free or low, depending on your country and doctor/physician | $1497 USD without shipping (price for 3 tests) |
In addition to that basic comparison, one difference between epigenetic tests and regular blood tests is a lack of actionable data from an epigenetic test. When you get the usual blood test it’s possible to figure out (or have an expert figure out) how to optimize the weak points and come back stronger next time.
If your glucose is high, you can work on your insulin sensitivity, maybe by using a CGM like I did recently, to see how your body reacts. If your CRP is high, you can look at reducing body fat or supplementing curcumin, etc., there are endless ways to make the blood test numbers meaningfully move in the right direction and therefore reduce your mortality risk.
With an epigenetic test the same can’t be said. Epigenetic changes are likely to be more downstream – the epigenetic damage is accumulating because there are suboptimal conditions in the body, which can often be identified with a normal blood test. Knowing just your biological age will not enable you to make any insights into how to improve that number.
Epigenetic test company: Hey, your biological age is higher than your chronological age, that’s not good!
You: Oh dang, how do I fix it?
Them: Get healthy! Here’s how to generally get healthy
You: Oh but what about me, specifically? What caused me to age faster?
Them: Your genes PCDHGA1, CDH22, OR10K2 and ATP4B aren’t methylating properly!
You: Oh dang, how do I fix it?
Them: Get a blood panel!
I did an epigenetic test through DoNotAge, which was a repackaged Muhdohub test, and the results seem pretty unreliable; they made a new app when they rebranded from Muhdo to Muhdohub and I still have both apps, so I have the exact same test from the same sample at the same company, and one of them shows a “hearing age” of 31.6 but the other shows 48!
The authors of PhenoAge themselves mention it in the paper:
[…] measures of physiological dysregulation will be better predictors of transition to the next stage in the aging trajectory (i.e. morbidity and mortality) than will measures of age related molecular alterations, like DNAm PhenoAge.
More specifically to these competitions there are differences in the way the winners are calculated, which can limit the transparency.
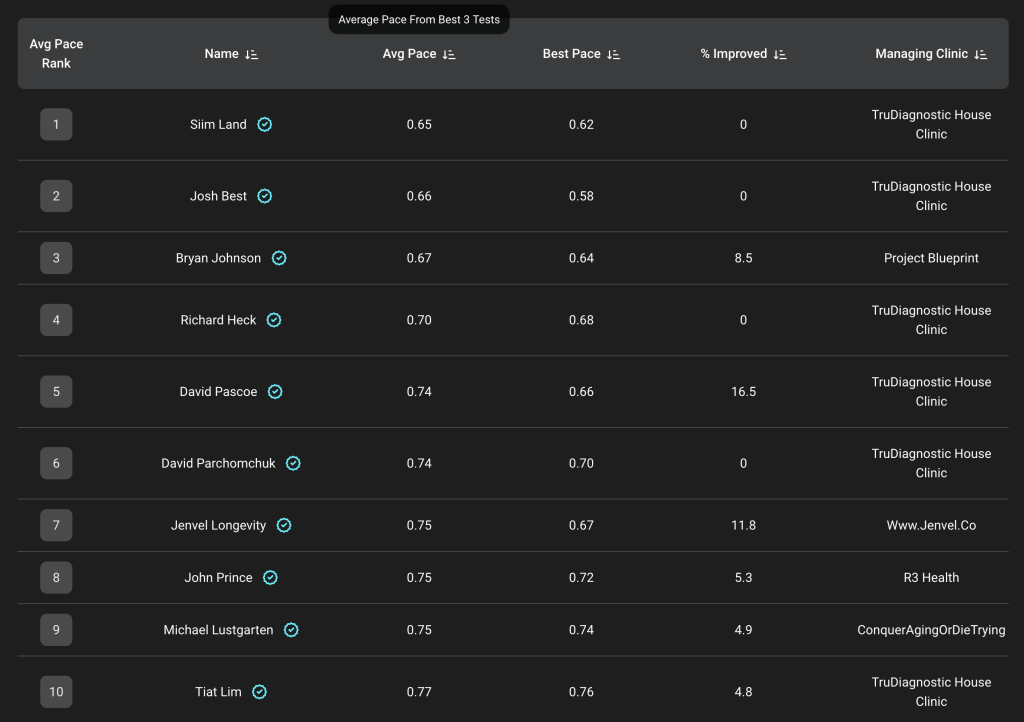
In the Longevity World Cup, the number you see is the lowest age for that year, not the latest one or an average. In the Rejuvenation Olympics, it’s more complicated. The list is ordered by the “Average pace from best 3 tests over 2 years“:

That goalpost has shifted over time, as has the level of transparency on the leaderboard, as we can see from this screenshot from 2024 showing the old “% Improved” column and no 2-year limit:
Given that it is a very expensive test to do, that time limit disincentivizes competition from those who aren’t rich enough to keep that up regularly.
The Longevity Cup has an even shorter timespan of only 1 year, but it is also either free or cheap to do, and isn’t locked in to one provider (even when you test via another company, they are using TruDiagnostic).
Those kinds of changes, and others behind the scenes, seem to be why the founder Dr. Oliver Zolman left the project in March 2025.
You might see some familiar names in that original leaderboard like Siim Land, Dave Pascoe, and even the LWC winner Mike Lustgarten. Mike currently sits in `159th place in the Rejuvenation Olympics, but he historically sat in 9th place, showing the huge differences between the two competitions.
What happens if we do the same comparison the other way? Bryan Johnson posted the results of two blood tests online last year, so we can easily plug those in and figure out his position on the Longevity World Cup:

The best blood test of the two he posted would get him to 102nd place.
We can do the same thing with the historical winner of the Rejuvenation Olympics, Siim Land, who publicly did a comparison of his blood results with Bryan’s last year12.

He would be in 7th place if he entered, which is interesting because it makes him one of the few people who has been top 10 in both competitions.
Dave Pascoe is doing great too, with a historical 5th place in the Rejuvenation Olympics and a current 19th place in the Longevity World Cup. Top 20 in both competitions is incredible. Great job, Siim and Dave!
My results
So how do I stack up? I haven’t entered the Rejuvenation Olympics so I don’t know how I would be doing there. I think it’s interesting, and I was close to entering at one point when they had a sale, but even at 50% off it was very expensive, especially because shipping the tests to my country every 3 months almost doubled the cost of the kits. It seems they have since stopped shipping the kits outside of the USA anyway.
In the Longevity World Cup 2025 season, I actually have a divisional win! I got #1 in the Millennials Open League. I also placed top 10 in the Open division at #8, and #35 in the Millennials generation.
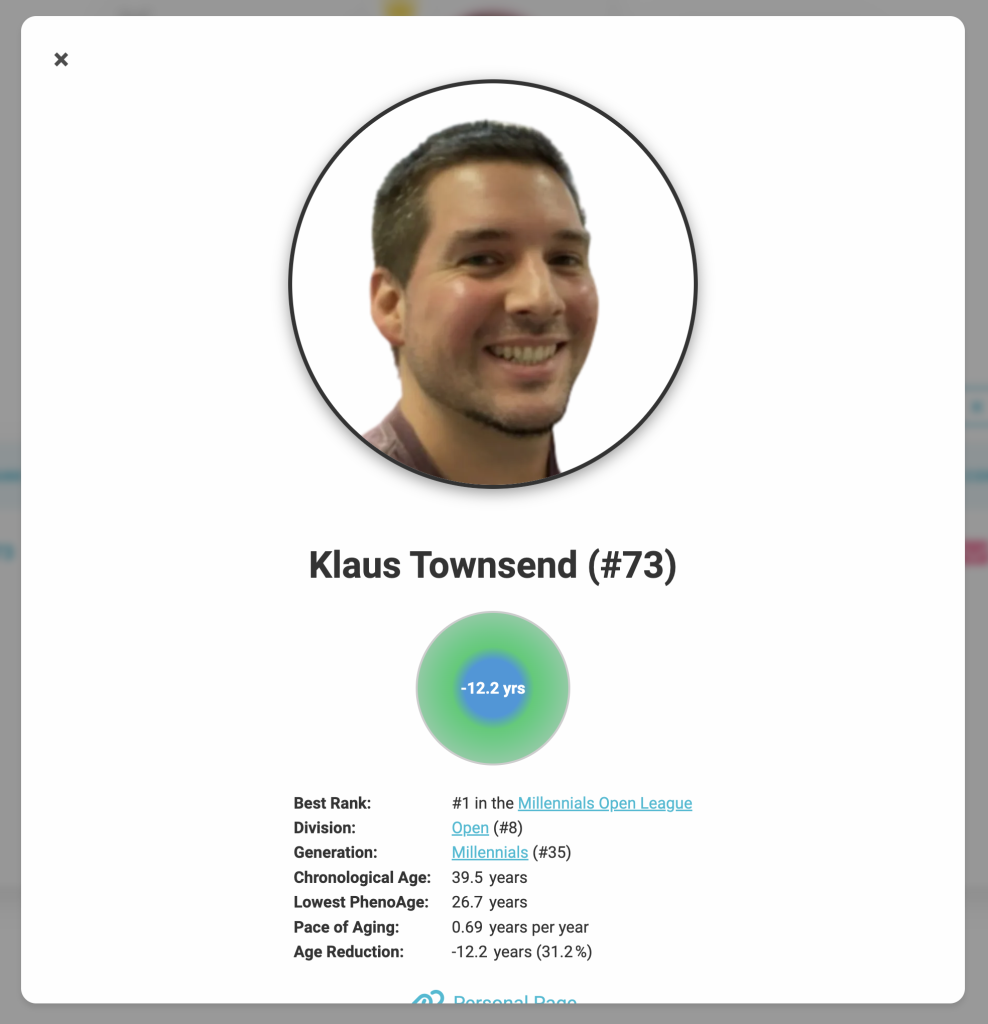
In the ultimate division, I finished at #73 overall, and #61 when ranked by pace of aging. When I entered I was at #49 overall, but that gradually sank down as more people entered above me, which is great for the competition and makes me more determined and inspired for next season!
Longevity World Cup in 2026
In 2026, the Longevity World Cup will be switching to a different aging clock for its main competition, but the phenotypic age will continue as a secondary competition. Will the new one be Bortz13, which is claimed to have an 11% relative increase in predictive value over PhenoAge? Or could it be LinAge214, which is a much more comprehensive test? Or could it be SevenAge15, which is notable for not taking chronological age as an input? Or will it be something else entirely?
In addition to being a competitor in the Longevity World Cup, I am also a contributor. Adam and the team have been incredibly friendly and welcoming, and really want the community to thrive. So in 2026 I will continue to be a part of its development, and I’m really excited to see where it goes. This is only the beginning.
Conclusion
I hope this article has demystified biological aging for you, and provided some useful information about the competitions.
I want to finish with some questions for you. Do you know of any other active longevity competitions? What do you think about these two? And most importantly, will anyone end Mike Lustgarten or Bryan Johnson’s reign in 2026? It could be you!
- Steve Horvath publications on PubMed ↩︎
- Luigi Ferrucci publications on PubMed ↩︎
- Morgan Levine publications on PubMed ↩︎
- Brian H Chen publications on PubMed ↩︎
- An epigenetic biomarker of aging for lifespan and healthspan ↩︎
- DNA methylation age of human tissues and cell types ↩︎
- Jan Gruber publications on PubMed ↩︎
- Reframing biological age as risk-equivalent age ↩︎
- A sex-adjusted 7-biomarker clinical aging clock for translational preventative medicine ↩︎
- DunedinPACE, a DNA methylation biomarker of the pace of aging ↩︎
- DunedinPACE on GitHub ↩︎
- I Analyzed Bryan Johnson’s Biomarkers and The Results Are… ↩︎
- Biological age estimation using circulating blood biomarkers ↩︎
- LinAge2: providing actionable insights and benchmarking with epigenetic clocks ↩︎
- A sex-adjusted 7-biomarker clinical aging clock for translational preventative medicine ↩︎